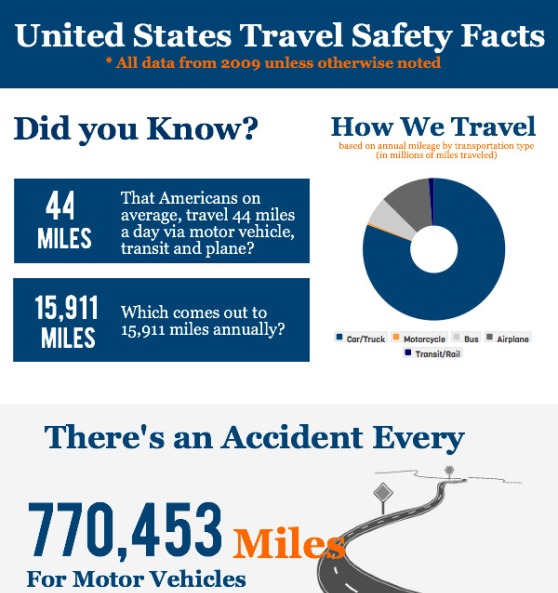
This travel info-graphic looks at US Travel Safety by airplane, car/truck, bus, motorcycle and other forms of transit. There sometimes are misconceptions about the safety, or lack of safety in each of those different methods of travel so the hope is to perhaps dispel some of those misconceptions.
A common misconceptions about flying that this info-graphic dispels is the fact that travel by air is only 7 times safer than driving in terms of the percentage of fatal accidents per mile traveled. Most traveler believe flying to be 100 or 1000s of times safer then traveling by motor vehicle however when you factor in the fatalities that result from small planes and commercial planes, it’s only 700% safer than flying.
Another statistic that may surprise some is the number of miles that the average American travels each year by plane, motorcycle, bus, car, truck or public transit such as train or rail. 15,911 miles seems a bit high but the statistics provided by the National Highway Traffic Safety Administration prove otherwise.
The infographic was researched using US census statistics from 2009 as well as stats from the NTSA (National Highway Traffic Safety Administration).
This infographic was created for Austin Personal Injury Lawyer Zinda & Davis PLLC. Their aim is to raise awareness of the hazards of travel while educating people about transportation safety in the United States.
(Click on the image for full view)
Source: zdfirm.com


